
- This topic has 19 replies, 4 voices, and was last updated 8 years, 1 month ago by
 aasif bashir dar.
-
AuthorPosts
-
-
February 26, 2016 at 8:48 pm #30357
 Aadil RazaParticipant
Dear All
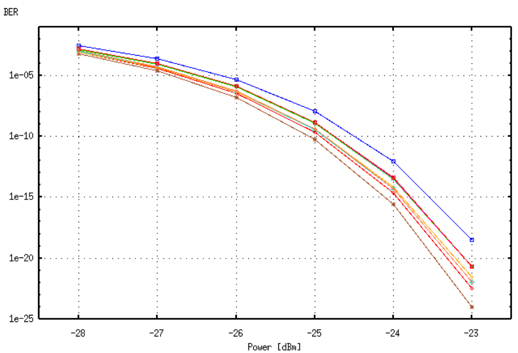
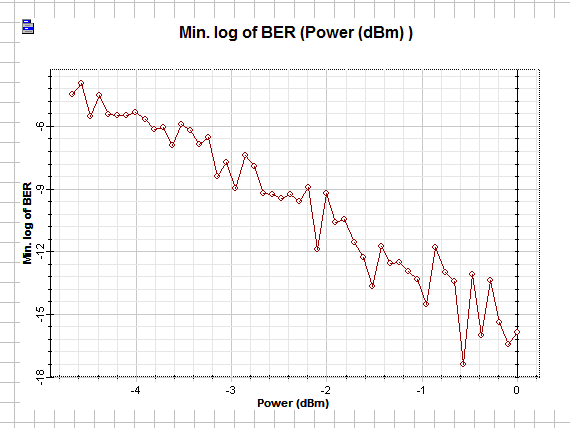
I am looking for a smooth water fall graph for BER x Input Power but if you see Report in attached file there are too many fluctuations.Please help me out how we can get a very very smooth graph like shown in attached sample picture.
Attachments:
-
February 26, 2016 at 8:50 pm #30359Aadil RazaParticipant
Please see sample picture here.
Attachments:
-
February 26, 2016 at 9:13 pm #30361
 Aabid BabaParticipant
Hello aadil,
as i could see from the screenshot , you BER Vs power graph is not that so bad. If i could understand by “smooth” , do you mean BER max and then doping suddenly such that it looks like a waterfall? Is it?If you want smooth transition of the curve without much fluctuations you can use more sweep iterations for power levels. I guess here you have swept power for 5-6 iterations.
Hope it helps.Best regards
-
February 26, 2016 at 9:32 pm #30363Aadil RazaParticipant
Thanks Abid for your reply. This Screen shot is just a sample graph. I am interested like this graph for my system. if you please open attached file BER-x-Input-power.osd and run it and then see graph in Report you will find what I am asking. Now I am attaching my system BER graph snapshot for your convenience.
Attachments:
-
February 26, 2016 at 11:16 pm #30387
 alistuParticipant
Hi Aadilqau,
One reason for the fluctuations in your results is the fact that the bit sequence is rather short. I ran your simulation again and this time, instead of 256 bits, I used 4096 bits. You can see the obvious improvement in the results. you may get better results by increasing it further.
Regards
Attachments:
-
February 26, 2016 at 10:32 pm #30372Aabid BabaParticipant
Sorry aadil i can’t open your .osd file right now as its weekend and i use licensed software of my institute.
Shall have a look at it on monday hopefully.Can you tell me what are you exactly designing?
By looking at the 2nd screenshot i see that your BER is all over the place. I can infer that You have swept some parameter way too many times. Keep the iterations to an optimum no of times.
regards -
February 26, 2016 at 11:22 pm #30389
 aasif bashir darParticipant
hi aadil,
i think you are using too much iteration for the power input.there are too much variation in your graph because of very large no of iterations over a large power range of -5 to 0 dbm.
more over I tried to open your file it does not opened. i will soon make my own file and post it here, be patient till then.
with regards
-
February 26, 2016 at 11:29 pm #30390aasif bashir darParticipant
hi aabid,
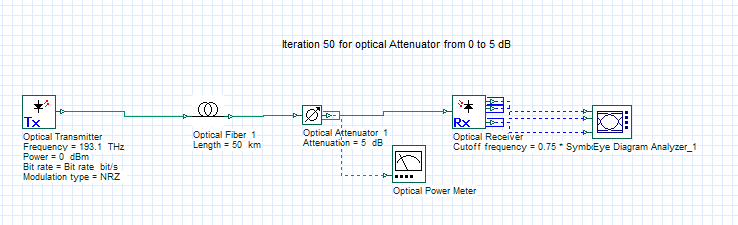
thanks for your patience, as i mentioned your where using too many iteration over then power range of -5 — 0dbm. I am attaching the a basic .osd file which i have designed.
i suggest to have look on this .osd file. and feel free for further discussion.
with regards
Attachments:
-
February 26, 2016 at 11:31 pm #30392aasif bashir darParticipant
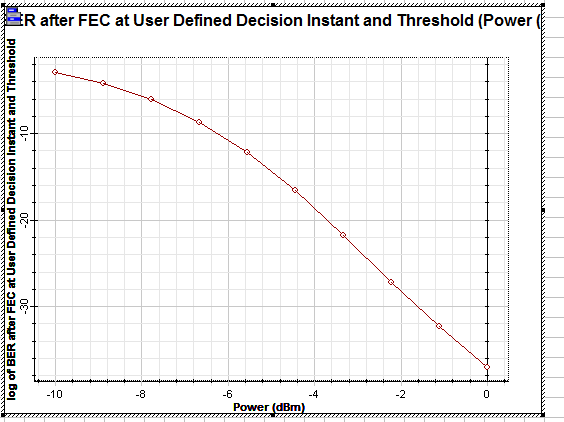
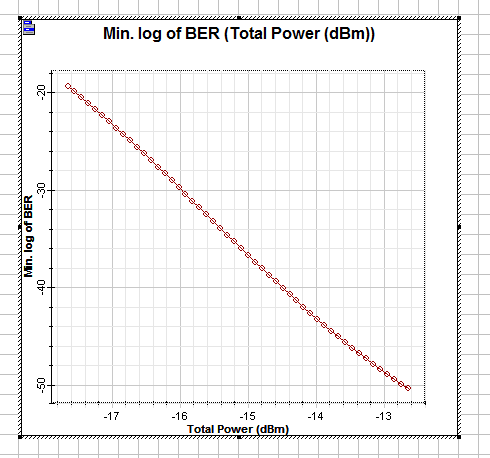
for your convenience i am also attaching the graph which i got after simulating this .osd file.
Attachments:
-
February 26, 2016 at 11:34 pm #30394Aabid BabaParticipant
Thank you asif for your efforts. I was sure about the no of iterations he used was way too high. Anyway, very kind of you to simulate it.
regards
-
February 26, 2016 at 11:52 pm #30395aasif bashir darParticipant
hi all,
-
February 26, 2016 at 11:52 pm #30396aasif bashir darParticipant
hi all,
lets wait for aadil , if he will get the results it would be my pleasuse.besides that alistu has also suggested on important point on the increase in the bit sequence, i appreciate his point
with regards
-
February 26, 2016 at 11:58 pm #30398Aabid BabaParticipant
Actually it has to do with number of iterations only. The more the number of insertions he is using the more the graph will be fluctuated.
He is keeping the range between two consecutive points in the sweep very minimal and because of that thing only the graph is very much fluctuating.I am sure asif has only reduced the number of iterations and kept the range between two consecutive points in the sweep to an optimum.
regards
-
February 27, 2016 at 12:09 am #30399aasif bashir darParticipant
hi aaabid,
no doubt i got the the results which the aadil neede , but in my thiking alistu has more valid poit than me.because no. of of iteration is good, because it removes the ambiguity reading that may occur in between two iterations of large range.
for example:
i am taking total iterations of ten from the power range of -10 dbm to -1 dbm. this means i am taking measurements at -10,-9,-8,….-1 power levelsone the other hand, if the no of iteration s are incresed we are taking reading at very finer level in a given range,
appreciations for alistu for this..
with regards
-
February 27, 2016 at 12:17 am #30400Aabid BabaParticipant
No doubt that is also a valid point. I did not disagree with that either but if you carefully see both the graphs : one you plotted and the other alistu plotted , i find your graph more precise and less fluctuating.
No doubt Alistu’s graph almost depicts same response but i find the later more smoother and that is what was the requirement.
I hope you got what i am trying to point out.
regards -
February 27, 2016 at 12:55 am #30401aasif bashir darParticipant
hi aabid,
your are welcome,
with regards
-
February 27, 2016 at 10:47 pm #30416Aadil RazaParticipant
Thanks all for help and guidance.
I have analysed and found following things….
1. Increasing Sequence length does not make the BER graph smooth (you can yourself observe it in attached file.)
2. Making iterations too high or low also does not effect the BER graph smooth. I think logically it does not make sense.We can have even more than 100 iterations for getting very precise and smooth graph.
3. What I really found working is just disabled “Generate random seed” in components properties which then gave smooth BER graph.
4. One important Thing: If you make multiple iterations for a single set-up without sweeping values you will see different BER value for each iterations and this was making the BER graph fluctuating and this issue is resolved by disabling “Generate random seed” in components properties.
Thanks
-
February 27, 2016 at 11:00 pm #30417Aadil RazaParticipant
Please see snapshots
Attachments:
-
February 27, 2016 at 11:39 pm #30420alistuParticipant
Hi Aadilqau,
Sure disabling generating random seeds would have the effect you want, so you yourself have solved your problem. However, the image I have attached in my previous comment shows the curve and I believe the smoothness is obvious, comparing to the case with 256 bits.
Using less iterations may reduce the fluctuations, but at the cost of reducing accuracy, whereas using more iterations overcomes the problem by increasing accuracy.
Regards
-
February 28, 2016 at 7:40 am #30423aasif bashir darParticipant
hi aaabil,
i agree with you that disabling random seed does provide smooth graph, but ;
the attached file which i had attached earlier,in which the components do not contains disabled “Generate random seed” in components properties, still my graph was smooth.
can you explain that????
with regards
-
-
AuthorPosts

- You must be logged in to reply to this topic.