
When a View is displayed, it is in the form of a two-dimensional graph, and there are
a certain number of properties that can be modified for this graph. Right-clicking
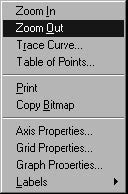
anywhere on this Graph View will make a context menu appear with options that can
be performed on the Graph View. These options include Zoom In and Zoom Out,
Trace Curve, Print, Copy Bitmap, Curve Properties, Axis Properties, Grid Properties,
Graph Properties, and Labels.
Zoom In
The Zoom In option zooms into the graph by dragging a rectangle around the graph,
and displays zoomed in values on both axes.
Zoom Out
Zoom Out returns the graph to default scale (no zoom at all).
Trace Curve
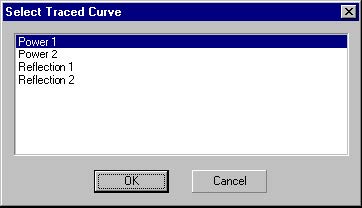
Trace Curve offers the unique option of tracing a particular curve on this View. When
selected, a Select Trace Curve dialog box offering a list of all of the curves on the View
appears.
The user selects a curve. The selected curve is being inspected. Moving the cursor
moves the crosshair that traces along the selected curve and the window displayed
on top of the View will show the X and Y values. This is useful when observing exact
values at particular wavelengths or at particular X values, as opposed to just viewing
the graph.
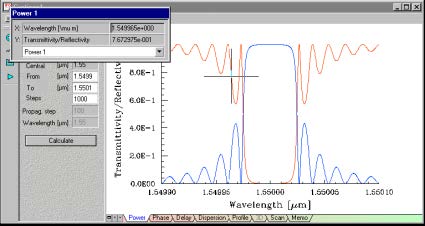
From the drop-down box, any other curve in this View can be selected and the
crosshair will continue by tracing that particular curve. Selecting the Trace Curve
feature again will disable this feature.
Table of Points
This option will show a window, which can be used to view the data points of the
curves in the graph.
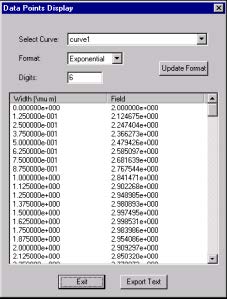
From the drop down menu, any curve in the view can be selected. The data points of
the curve will be displayed in the table. The display format options can be changed by
choosing the new display format, and/or by changing the number of digits, and then
pressing the Update Format button. The data points of the currently displayed curve
can also be saved into a text file, by pressing the Export Text button. This will open
the Save dialog box, which will ask for the location to save the file.
Copy Bitmap
The option called Copy Bitmap allows copying the graph as a bitmap to the clipboard
and pasting it to any bitmap drawing program for further editing.
Any graph in the system can be printed by right-clicking and selecting Print, which
creates a full-page printout of this graph.
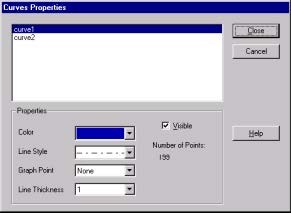
Curve Properties
Another option from this menu is Curve Properties. Curve Properties offers a list of
curves where the curve color, line style, thickness, and the type of graph points that
it will draw can be modified. If too many curves are displayed at the same time, curves
can also be set to invisible (and not show up on the graph) to reduce the clutter.
Axis Properties
The next option from the menu is Axis Properties. All the active axes are offered as
choices for property modification.
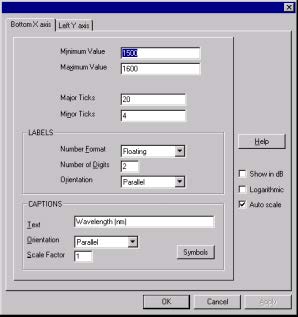
It supports three number formats: floating, exponent and power.
Other parameters for graphs include the number of digits displayed and orientation
with respect to the axes. Modification of the axis captions, orientation, as well as the
size of the axis (Scale Factor) can be done, as well as the entering of particular
mathematical symbols within the caption by choosing the Symbols button in the
bottom right corner.
On the right-hand side, the Auto Scale option automatically scales the axes to the
graph, as well as the Logarithmic option for logarithmic display of data. The same
options are offered for all the axes.
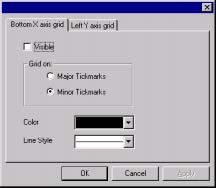
Grid Properties
Grid View Properties supports editing of horizontal and vertical grids. In all grid
options, the user can decide whether the grid is visible, where the grids should be
positioned (on major or minor tickmarks), the color of the grid, and the line style of the
grid.
Graph Properties
The properties of the graph can be edited in the Graph Properties option. The Title
box offers the option of editing the caption (title) of a Graph, as well as the position,
size, and scale factor.
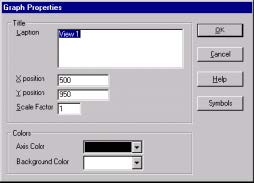
The Colors option allows for the selection of the colors of the axes and the
background.
Labels
Labels in the Graph View can be added by choosing the Label, Add option, and typing
it in. Once created, the label can be moved around the graph, using the click and drag
technique, in order to label any part of the graph. The labels can also be resized by
dragging the corners of a label.