
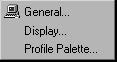
The Settings menu gives you a fast and easy access to the General and Display
Settings dialog boxes and to the Profile Palette.
General Settings
File: New > Module option > File: Settings > General
Using the General Settings command
The General Settings command allows you to define the general settings you will use
in the selected graph display. It opens the General Settings dialog box in which you
can define the following characteristics: Color, Viewport Border, General Caption, and
Digit Font Size.
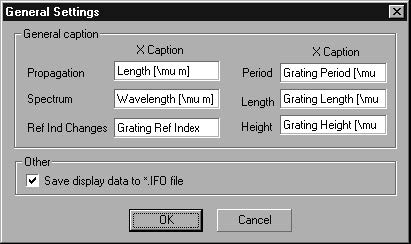
General Caption
Gives you options for the horizontal X-axis of the graphical display.
Note: You can save the display data to the *.ifo data file if you enable the
appropriate check box.
To open the General Settings dialog box
| 1 | File > New. |
| 2 | In the New dialog box, click one of the five modules. |
| 3 | From the Settings menu, click General. |
| 4 | In the General Settings dialog box, set your preferences for color, viewport border, general caption, and digit font size. |
| 5 | Click the OK button. |
Note: There are numerous symbols supported by the program. They include
Greek symbols, mathematical symbols, and special symbols. To display a
symbol, enter the symbol name preceded by a backslash: symbol name. For
example, to display the Greek symbol λ, enter lambda. The backslash affects
only the next symbol name. However, the symbol name must be separated from
the following character by a space. For example, to display μm, enter mu m.
Display
File: New > Module option > Settings: Display
Using the Display Command
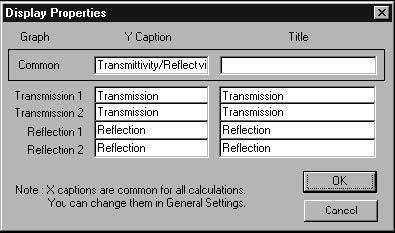
The Display command allows you to define the display settings you will use in
OptiGrating. The Display command opens the Display Properties dialog box in which
you have two options: changing the Y caption and changing the title of your
calculations.
To open the Display Properties dialog box
| 1 | File > New. |
| 2 | In the New dialog box, click one of the five modules. |
| 3 | Click the graph you are working with. |
| 4 | From the Settings menu, click Display. |
| 5 | In the Y Caption boxes, change the Y caption of your calculations. |
| 6 | In the Title box, write a new title for your calculations. |
| 7 | Click the OK button. |
Note: The X captions are common for all calculations. You can change them in
the General Settings dialog box.
Re-sampling 3D Propagation Graphs
To define the properties of a graph in 3D view, you have to open not the Display
Properties dialog box but the 3D Graph Properties dialog box. In this box you can
resample a 3D Propagation graph.
The resampling will speed up your 3D Propagation display, but it won’t affect your
calculation. Even if you calculate 500 points in the propagation direction, you will see
that the graph will be re-sampled according to the value specified in the 3D Graph
Properties dialog box.
To define a graph’s properties when working in a 3D view
| 1 | Click the graph you are working with and click the 3D tab. |
| 2 | From the Settings menu, click Display to open the 3D Graph Properties dialog box. |
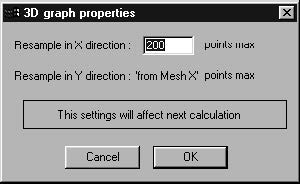
| 3 | In the 3D Graph Properties dialog box, type the number of points for resampling in the X direction. |
| 4 | Click the OK button. |
Note: To access the 3D Graph Properties dialog box, you can also click the graph
with the right mouse button and from the pop-up menu select Display Options.
Profile Palette
File: New > Module option > Settings: Profile Palette
Using the Profile Palette Command
The Profile Palette command becomes available in the Settings menu when you are
working in the Profile or in the 3D Propagation window. You can choose one of the
following predefined palettes: Rainbow, Gray Scale, Red, Green, and Blue.
To open the Palette Selection dialog box
| 1 | In the Project window, click either the Profile tab or the 3D tab. |
| 2 | From the Settings menu, click Profile Palette to open the Palette Selection dialog box. |
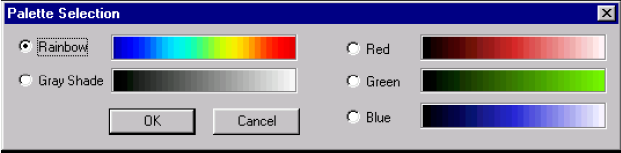
| 3 | In the Palette Selection dialog box, click one of the five buttons – Rainbow, Gray Scale, Red, Green, or Blue – to enable it. |
| 4 | Click the OK button. |
Note: If you are going to print a 3D graph on a black and white printer, it is
advisable that you select the Gray Shade palette option.