
The Graph control is a versatile, powerful easy-to-use tool for observing data (see
Figure 4). This section gives a brief description of some of the 2D graph control
features and an explanation of how to use them.
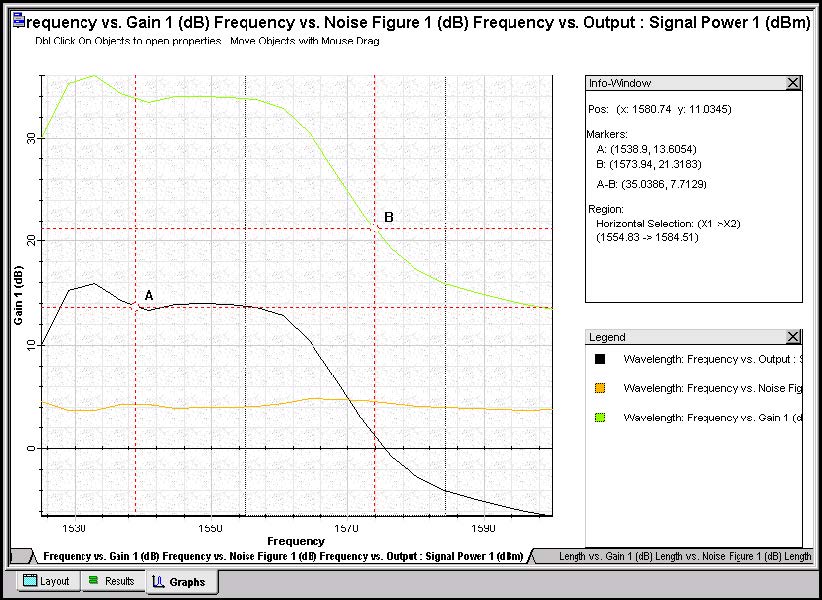 Figure 4: Opti2D Graph Control
User interface features
| Features | Description |
| Large data handling capabilities | Opti2D Graph control is capable of handling millions of points. |
| Optimized drawing | Even with a large number of data points, Opti2D Graph Control is optimized to allow for smooth tracing and panning of graphs. |
| Moveable information windows | Moveable information windows allows for placement of the windows in the most convenient location in the graph window. |
| Crosshair | Visible cross to make seeing trace points easier. |
| Graph toolbox | The popup Graph toolbox allows easier access to the viewing/ organizing/editing capabilities of the Opti2D Graph tool. |
| Graph Menu button | The Graph menu button allows you to access a full list of functionality associated with the graphs and their data. |
Information windows
There are two main windows visible on the main display:
- Info-window
- Info-Window settings dialog box
Both can be launched using the Graph menu or Graph tools.
Info-window
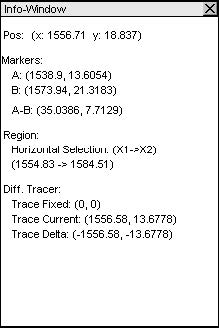 Figure 5: Info-window
When you access the Info-window, it displays in the work area of the graph view. By
default, it displays the current position (in data-base coordinates) of the cursor. When
you add marker, tracers, and regions, the Info-Window expands to show the details
of these components.
When you use the Select tool, if you double click in the window, the Info-Window
properties dialog displays (see Figure 6).
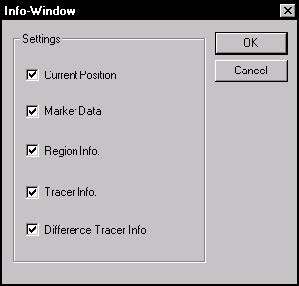 Figure 6: Info-Window settings dialog box
Legend
You can switch the Legend on and off using the Legend tool in the Graph toolbox, or
the Graph menu. The Legend displays a list of all the curves displayed in the graph
with the corresponding line color that is used to display those curves (see Figure 7).
Use the Minimize/Maximize button to change the display of the Legend, or close the
Legend by using the Close button.
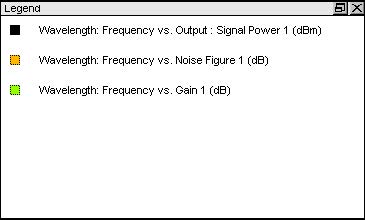 Figure 7: Legend
Graph toolbox
To access the Graph toolbox, right-click in the graph view. Most graph editing/viewing/organizing capabilities are accessible using the toolbox (see Figure 8).
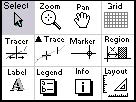 Figure 8: Popup Graph Toolbox
Graph tools
| File menu item | Toolbar button |
Description |
| Select | Allows you to manipulate and move most of the objects on the Graph.Note: To edit the properties of an object, double-click the object in the graph view. | |
| Zoom | Zoom in: You can select a rectangular region, or click in the graph view for proportional zoom in. Extra features:
|
|
| Pan | If |
Allows you to pan from side to side in the graph display to see parts of the graph that may not be visible at the existing Zoom level or resolution.To pan, click to grab the display, and move the cursor from side to side.Extra Features:
|
| Grid | 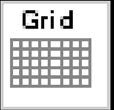 |
Allows you to turn the grid lines on/off. Click on the Grid tool to toggle the grid lines. |
| Tracer | 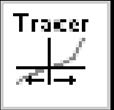 |
Allows you to select a curve and trace over it while viewing the exact positional values on the curve in the Info Window. To select a different curve, double click in graph view. |
| Trace | Allows you to select a curve and trace over it while viewing the exact positional values on the curve in the Info Window. The Difference Tracer differs from the Tracer tool because it allows you to create a second tracer to compare values on either the same curve or on different curves. To select the next curve, double click on the curve in the graph view.Extra Features:
|
|
| Marker | 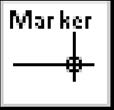 |
Allows you to place markers in the active graph view. The markers can be horizontal, vertical or both. The position of the markers is displayed in the Info Window. |
| Region |  |
Allows you to select a horizontal, vertical or rectangular region in the active graph view. The coordinates of the selection are displayed in the Info Window. |
| Label |  |
Allows you to place customized labels in the active graph view. |
| Legend |  |
Allows you to toggle the Legend on and off within the active graph view. |
| Info |  |
Allows you to toggle the Info-Window on and off within the active graph view. |
| Layout | Allows you to reset the layout and place all windows in their default positions. |
Graph menu
To open the Graph menu, click the blue icon at the top left corner of the Graph view
(see Figure 9).
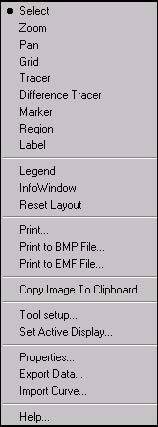
Figure 9: Graph Menu
Graph Menu button
The Graph Menu button is in the top left corner of the graph view.
Tools
The tools available from the Graph menu include:
- Select
- Zoom
- Pan
- Grid
- Tracer
- Difference Tracer
- Marker
- Region
- Label
Windows
The information windows available in the Graph Menu include:
- Legend
- Info Window
- Reset Layout
Printing and exporting files
Opens the Print dialog box and allows you to print an image of the active graph view
(see Figure 10).
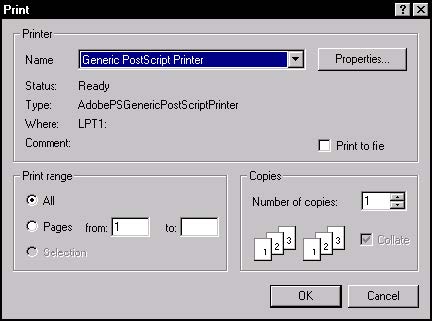 Figure 10: Print dialog box
Print to BMP file
Exports an image of the active graph view to a file in .bmp format using the Save As
dialog box (see Figure 11).
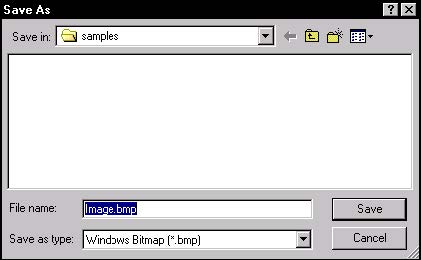
Figure 11: Print to BPM File
Print to EMF file
Exports an image of the active graph view to a file in .emf format using the Save As
dialog box (see Figure 12).
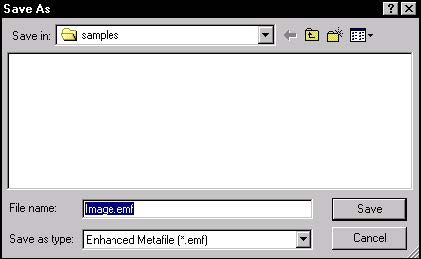
Figure 12: Print to EMF File
Copy image to clipboard
Copies an image of the active graph view to the clipboard.
Utilities
Tool setup
Allows you to modify the properties of some of the tools.
Note: The tool property dialog only launches if the active tool allows settings to be changed.
Set Active Display
Allows you to select the active display. For more information, see “Displays” on page 231.
Properties
Allows you to launch the Graph Properties dialog. For more information, see For more
information, see “Graph display” on page 232.
Table of Points
Launches a dialog box that displays a list of all the curves on the graph control and
displays the data coordinates of those curves. It also allows you to export the data
points to a text file (see Figure 13).
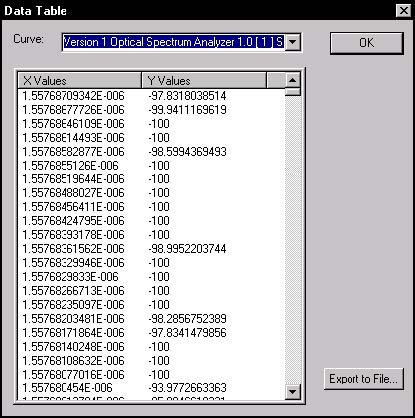 Figure 13: Data Table dialog box
Help
Launches a help dialog box specifically related to the Opti2D Graph Control.
Import Curve
Allows you to import a curve from a text file. The file must be in the format below.
X1 (tab) Y1
X2 (tab) Y2
Etc…
Ex:
// (Beginning of file) (this line should not be in the file)
123.23 123.45
123.24 124.55
123.25 555.5
123.26 222.22
//(End of file) (this line should not be in the file)
Displays
The graph is made up of layered displays. Each display has a pair of axes. By default, the control contains one display with Axis X on the bottom of the display and Axis Y on the left. In the case of complex graphs that require more than one pair of axes, more than one display exists (see Figure 14).
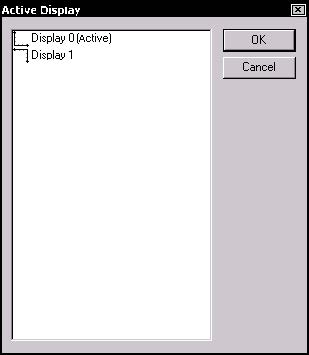 Figure 14: Active Display dialog box
Any objects that you place on the graph are placed on the active graph view. Therefore, if you place a marker on the graph and Display 1 is active, the new marker is based on the coordinate system of Display 1. If you want to add a marker on Display 2, you must select the main menu in the Graph menu. This launches the Graph Display dialog, which permits you to select a different display. In complex graphs, the displays are layered one on top of the other (see Figure 15).
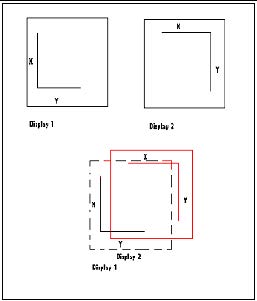 Figure 15: Graph display
Graph Properties dialog
The Graph Properties dialog allows you to manage properties of the graph.
The Graph Properties dialog tabs include:
- X-Axis
- Y-Axis
- Properties dialog box-Y-Axix tab
- Grid
- Fonts
- Legend
- Properties dialog box-Legend tab
- Label Management
X-Axis
The X-Axis Tab allows you to set properties of the X-axis (see Figure 16).
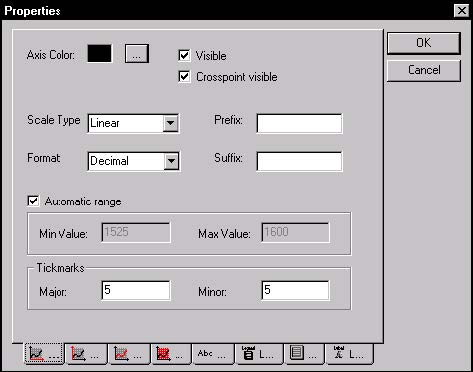 Figure 16: Properties dialog box-X-Axis tab
The values in Scale Type can be:
- Linear
- Logarithmic
- DB
The values in Format Value can be:
- Decimal: simple decimal values (1000.0, 2000.0, 3000.0)
- Exponential: exponential notation (1.0-e3, 2.0-e3, 3.0-e3)
- Engineering: engineering notation (1k, 2k, 3k)
- Scientific: scientific notation (1.0 x 103,2.0 x 103, 3.0 x 10³)
Prefix: You can place a prefix string before each of the scale values.
Suffix: You can place a suffix string after each of the scale values (e.g. 1000.0 nm)
Automatic Range, Min Value, Max Value: You can check Automatic Range, which sets the range according to the curves in the displays, or force the axis range to certain values.
Tickmarks: You can set the number of major and minor tick marks on the Axis.
Y-Axis
The Y-Axis Tab allows you to set properties of the Y-axis (see Figure 17). To see descriptions of the Y-Axis dialog fields, see “X-Axis” on page 196.
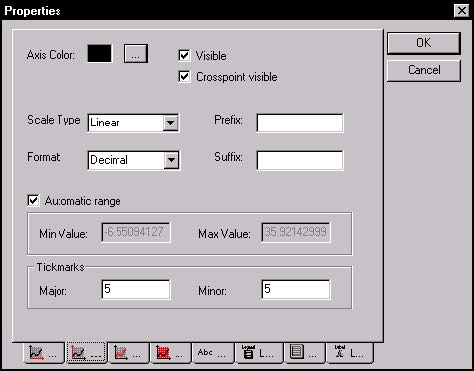 Figure 17: Properties dialog box-Y-Axix tab
Curve
The Curve tab allows you to set various properties of the curves that are added to the control (see Figure 18).
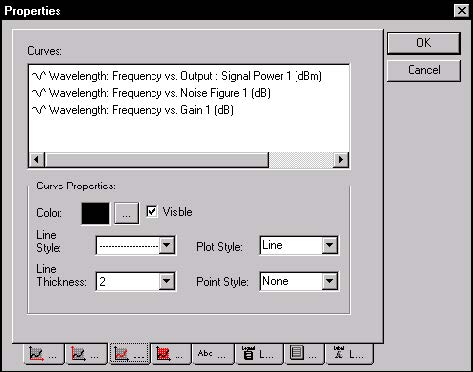
Figure 18: Properties dialog box-Curves tab
Curve List: Displays all of the curves on the active display.
Curve Properties
Color: Allows you to choose the color of the selected curve.
Line Style: Allows you to select the line style of the selected curve.
Plot Style: Allows you to select the plot style.
The values in Plot Style can be:
- Point
- Line
- Segment Left
- Segment Right
- Segment Center
- Step Left
- Step Right
- Drop Line
Line Thickness: Allows you to select the thickness of the currently plotted curve line.
Values range from 1 to 8.
Point Style: Allows you to select the style in which each point on the curve will be
drawn.
The values in Point Style can be:
- None
- Circle
- Square
- Diamond
- Cross
Grid
The Grid tab allows you to select which of the grid lines on the display are visible, and
what color they are to be displayed in (see Figure 19).
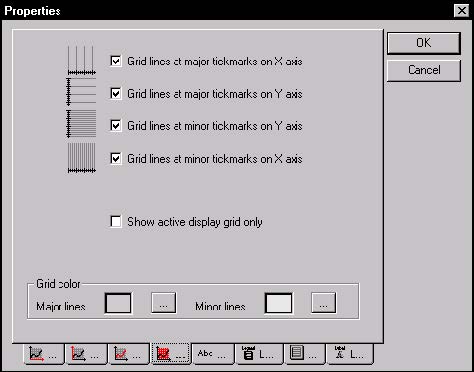 Figure 19: Properties dialog box-Grid tab
Fonts
The Font Tab allows you to select the fonts used for displaying titles and axis values.
(see Figure 20).
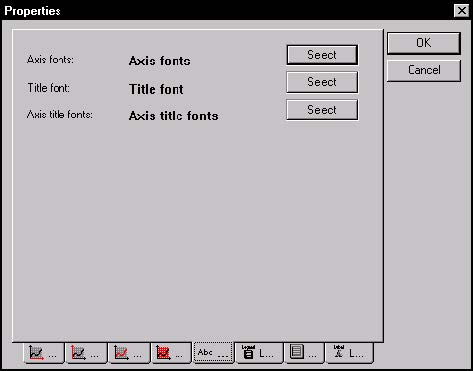 Figure 20: Properties dialog box-Fonts tab
Legend
Legend tab simply has a toggle for the Legend Visible/Invisible. More features will
become available in the future (see Figure 21).
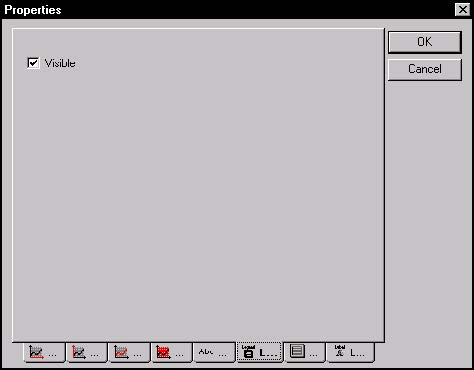 Figure 21: Properties dialog box-Legend tab
Graph
The Graph tab is used for editing the titles of any axis as well as the graph title itself
(see Figure 22).
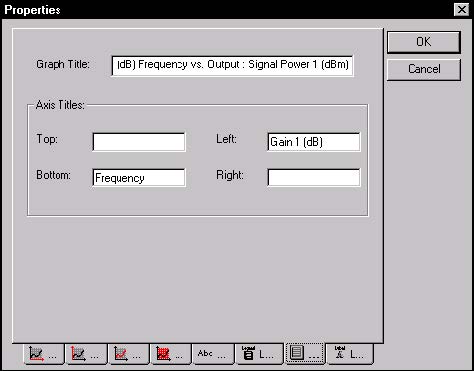 Figure 22: Properties dialog box-Graph tab
Label Management
The Label Management tab allows you to remove and edit labels on the graph. You can also access the Label Management function using the Label tool in the Graph toolbox (refer to Figure 23).
Note: For removing a large number of labels or labels that may have been positioned at coordinates that are not in the viewable area, it is easier to remove or edit them using the Label Management tab, because of the multiple selection feature.
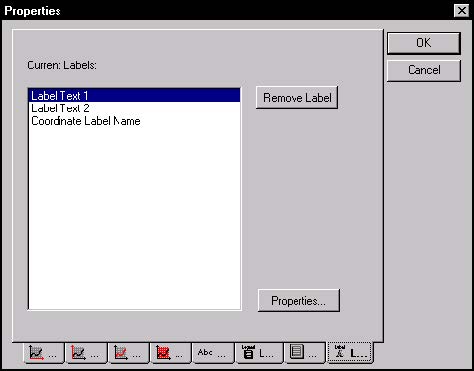 Figure 23: Properties dialog box-Label Management tab
Use the Label Properties dialog box to edit the name or coordinates of the selected label (see Figure 24).
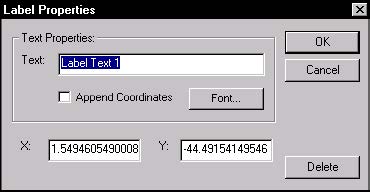 Figure 24: Label Properties dialog box