
The Titanium diffused waveguides in Lithium Niobate, or the Ti:LiNbO3 waveguides, are formed by the diffusion of the Titanium dopant into the Lithium Niobate host. To form a waveguide, a stripe of Titanium is deposited on the LiNbO3 substrate. For a given stripe width, which we identify with the waveguide width, the amount of Titanium is characterized by the stripe thickness before diffusion. The Titanium Lithium Niobate sample is heated for a few hours at temperatures that range from hundreds to a thousand degrees Celsius. The Titanium ions penetrate the host substrate and form a graded index waveguide. The graded waveguide has a bell-shaped refractive index distribution in the lateral and in-depth directions. The index distribution can be characterized phenomenologically by diffusion lengths or, as an alternative, by diffusion constants, diffusion temperature and a diffusion temperature coefficient. Moreover, since the Lithium Niobate crystal is anisotropic, the refractive index depends on the crystal cut and light polarization. Referring to the anisotropy, we distinguish between ordinary and extraordinary parameters. The material dispersion is also taken into account. The chromatic dispersion factor is different for ordinary and extraordinary cases.
The graded refractive index ni is a sum of the bulk crystal index ni(0) and the diffusion-induced index change Δ ni ,
![]()
where, depending on the crystal cut and polarization, we consider the ordinary ( o ) or extraordinary ( e ) index distribution. Due to the chromatic dispersion, the graded index also depends on the wavelength λ . The chromatic dispersion of the ordinary and extraordinary bulk index is computed using Sellmeier’s dispersion equations ( λ in μ m)
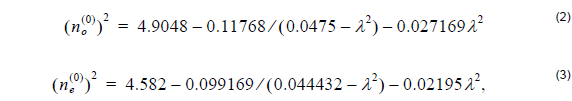
that are valid for wavelengths ranging from 0.43584 to 3.3913 μ m.
The diffusion-induced index change is described by the product of the dispersion factor di ( λ ) and the distribution function hi ( x, y ) [1],
![]()
where the dispersion factor is different for the ordinary and extraordinary cases ( λ in μ m)

In turn, the diffusion induced distribution function is a function of the distribution constant Fi , the dopant concentration profile c( x, y ) and the distribution power factor γi ,
![]()
where the distribution constants
Fo = 1.3 ⋅ 10 – 25 cm3
and
Fe = 1.2 ⋅ 10 – 23 cm3
and the distribution power factors
γo = 0.55
and
γe = 1.00
are different for the ordinary and extraordinary cases. They are fitted from published experimental data [1].
The concentration profile can be derived following the classical diffusion theory [2], [3]. The profile has a bell-shaped form
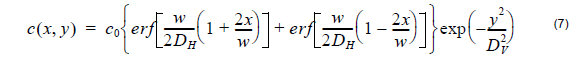
In the lateral direction, that is horizontal to the crystal surface, the profile is characterized by the combination of error functions. In the crystal in-depth direction, that is vertical to the crystal surface, it has a Gaussian shape. The profile’s parameters include the profile constant c0 , the dopant stripe width before diffusion w , the horizontal (lateral) diffusion length DH , and the vertical (in depth) diffusion length DV .
In OptiBPM, the dopant stripe width before diffusion is identified with the waveguide width provided by the layout.
The horizontal and vertical diffusion lengths

are functions of the diffusion time t and the diffusion temperature T . The temperature coefficient T0 and the diffusion constants D0H , D0V are specific for the Ti:LiNbO3.
OptiBPM provides the option to enter the horizontal and vertical diffusion lengths (Profile parameters Group I), or, alternatively, to specify the diffusion process by entering constant for the diffusion lengths (Group II).
The concentration profile constant is a function of the stripe thickness before diffusion τ , the dopant constant Cm , and the vertical diffusion length DV described earlier,
![]()
The dopant constant
![]()
is a material parameter determined by the dopant density ρ , atomic weight Mat and the Avogadro’s number NA . In the case of Titanium dopant, we assume:
ρ = 4.51 g ⋅ cm–3, Mat = 47.9 g ⋅ mol–1 which gives Cm = 5.67 ⋅ 1022 cm–3
The default values are taken from the published literature. There is, however, a discrepancy between constants provided by different authors. Therefore, OptiBPM allows a customization of the process data including the material parameters. Normally, the process is defined only by the diffusion lengths (Group I) or the diffusion time and temperature (Group II). The temperatures are entered in different scales (Celsius and Kelvin), in order to follow the laboratory practice and published data simultaneously. Internally, however, the program converts the entry values and uses only one system of units. The diffusion time is entered in hours, with fractions in the decimal notation.